Recent Posts
Replicating WEGO Plots using ggplot2
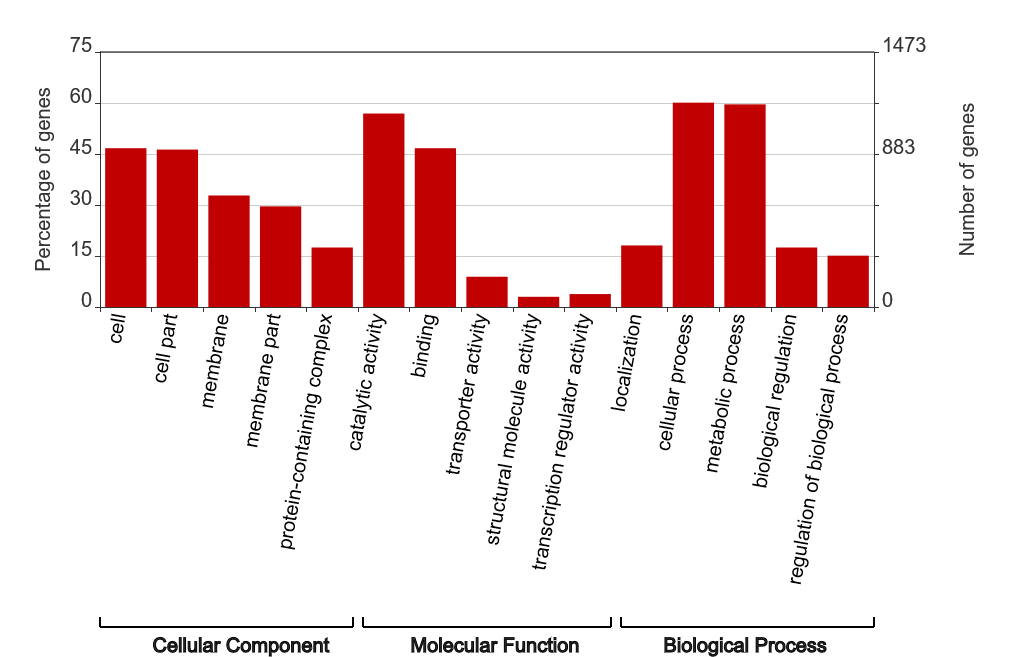
WEGO (Web Gene Ontology Annotation Plot) is a tool for visualizing, comparing, and plotting gene ontology (GO) annotation results. WEGO accepts various file formats, including GAF, XML, and TXT, making it compatible with BLAST2GO. It has an intuitive interface and produces satisfactory images like this:

Although most of WEGO’s features are neat, I found myself yearning for other subtler features, such as being able to sort the terms according to the number/percentage of genes or to automatically select the top n terms in each domain. Knowing that the only way I can attain exactly what I want is to do the visualization myself, I just exported the TSV file from WEGO and proceeded to let my fingers do all the work. The script can be divided into three parts:
R: Some Table Munging Tricks
I’ve been working with huge tables lately (at least 50,000 rows or columns). Sometimes you think you know all the basic commands you need to string together to get through any trouble, until a seemingly easy problem comes along to break this notion into a million pieces. Here are some handy table munging tricks:
- Select data frame columns by vector of names using dplyr
- Sort data frame columns according to vector of names
- Sort data frame rows according to vector of names
- Cast multiple value.var columns using reshape2 and data.table
Phasing Technologies (10x Genomics Chromium and Dovetail Genomics Hi-C)
Last January, I had the privilege of attending the Plant and Animal Genome Conference XXVI in San Diego, California. My boss calls it the only essential agrigenomics conference anyone needs to attend, and understandably so, because the big names in genomics—ones I would have never thought of coming into being beyond journal article bylines—are consistent attendees of this conference. The conference was divided into workshop sessions that tackled updates and recent developments from specific fields of study. I particularly enjoyed the sessions dedicated to bioinformatics in spite of my episodic inability to grasp the highly computational discussions.
Ubuntu 14.04 Login Loop and Missing Desktop Icons
After restarting my desktop the other day, I found Ubuntu 14.04 stuck in a login loop. It was not the first time this problem had reared its ugly head, and luckily, I was able to easily amend its first instance with the following steps:
- Login to
tty1by pressingCtrl+Alt+F1 - Reinstall Ubuntu desktop (i.e. Unity):
sudo apt-get install --reinstall ubuntu-desktop - Voila, reboot:
sudo reboot
Unfortunately, the second and most recent occurrence of the login loop was much peskier as the following attempts proved to be insufficient for solving the problem:
On Hadley Wickham, the Prolific R Developer
I spent the entire November writing scripts to generate the figures for my thesis and finding ways to make my data appear lovely. While it sounds leisurely when phrased in that manner, it was actually a month full of scouring Stack Overflow and Github pages for answers, trial and error with infrequent successes, misdirected anger springing from frustration, and countless coffee breaks. The packages dplyr, ggplot2, reshape2, and ggtree became my weapons of choice. I am actually fortunate to have had the opportunity to work with these packages several months earlier in prior engagements. Somehow it seems like the world knew what side quests and minor bosses to give to prepare me for the final boss fight.
I hadn’t given much thought about the big names in R until our Data Analytics professor mentioned this apparently prolific R developer named Hadley Wickham. A quick Google search of his name left me agape. He is guy who wrote all those R workhorse packages I am using! According to his personal website, his work can be divided into three categories: tools for data science (e.g. ggplot2, dplyr, stringr), tools for data import (e.g. readr, readxl, rvest), and software engineering (devtools, testthat). And so began my fascination with Wickham…